Regions
This report delivers insights into the traffic and bounce rates from various cities that visited your website. To access this data, it is essential to connect your Google Analytics account to the Labrika service.
Contents of the Report
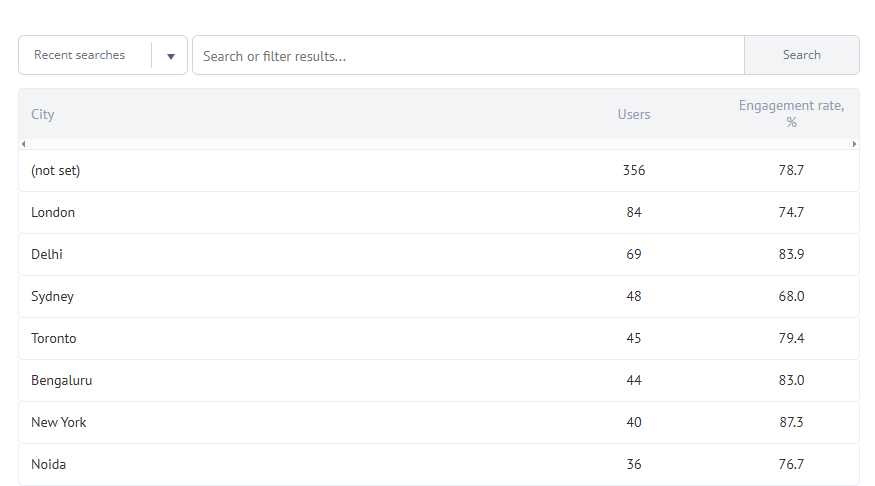
- The name of the city.
- The number of users from that city.
- The bounce rate originating from this city, calculated as the percentage of bounces compared to the total visits from that city. A bounce is defined as a visitor leaving the site without viewing any other pages.
- The number of lost users who ceased interacting with the site.
Utilizing the Report
This report highlights which cities generated the most visitors and which ones exhibited the highest bounce rates. Any parameters that deviate from the norm are marked in red. By analyzing this data, you can identify inappropriate traffic sources, such as cities where you do not offer services.
Examine which keywords ranked in the TOP-10 for these cities and consider modifying the content to reduce traffic from these areas if feasible. This adjustment can enhance the overall behavioral performance of your website and positively influence its ranking.
High Bounce Rate for Specific Regions
This report provides a detailed bounce rate analysis by city or region. Any anomalies, such as an unusually high bounce rate, will be highlighted in red. This may indicate the need to adjust the keywords you are currently using.
For instance, if you are targeting local keywords like 'Pizza in Los Angeles' while your business is located in New York, users will likely bounce back immediately due to unmet local intent.
To reduce traffic from these cities, consider removing any non-relevant local keywords from your content. This strategy can lead to better user engagement and lower bounce rates.
Understanding Bounce Rates
Bounce rates are crucial metrics that reflect how effectively your website engages visitors. A high bounce rate often indicates that users are not finding what they expected or that the content does not meet their needs. Understanding these rates can help you make informed decisions about your website's content and structure.
Factors affecting bounce rates include website design, content relevance, and user experience. By focusing on improving these areas, you can enhance user retention and satisfaction.
Strategies for Reducing Bounce Rates
To effectively reduce bounce rates, consider implementing the following strategies:
- Improve the website's loading speed to ensure a seamless user experience.
- Create engaging and relevant content that meets the expectations of your target audience.
- Optimize the website's design for mobile devices to enhance accessibility.
- Utilize clear and compelling calls to action to guide users through your site.
- Regularly analyze user behavior to identify areas for improvement.
Analyzing Bounce Rate Statistics
Regularly analyzing bounce rate statistics allows you to track performance over time and identify trends. This analysis can help you understand which pages are performing well and which may require adjustments. By comparing bounce rates across different regions, you can tailor your content to better serve your audience.
Conclusion
In conclusion, understanding and optimizing your website's bounce rate is essential for enhancing user engagement and improving overall performance. By leveraging the insights provided in the bounce rate report, you can identify problematic areas, implement effective strategies, and ultimately reduce bounce rates. This proactive approach not only leads to a better user experience but also positively impacts your website's rankings in search engine results.
As you work on reducing bounce rates, remember to keep monitoring your benchmarks and adjust your strategies accordingly. The key to success lies in continuous improvement and adaptation to the needs of your audience.
Additional Resources
For further assistance and resources on optimizing your website's performance, visit our Help Center. Here, you will find valuable tools and guides to help you navigate the complexities of digital marketing and SEO.